Notice
Recent Posts
Recent Comments
Link
| 일 | 월 | 화 | 수 | 목 | 금 | 토 |
|---|---|---|---|---|---|---|
| 1 | 2 | 3 | 4 | 5 | ||
| 6 | 7 | 8 | 9 | 10 | 11 | 12 |
| 13 | 14 | 15 | 16 | 17 | 18 | 19 |
| 20 | 21 | 22 | 23 | 24 | 25 | 26 |
| 27 | 28 | 29 | 30 | 31 |
Tags
- js코테
- 백준구현
- 프로그래머스JS
- JS
- 리액트커뮤니티
- 포이마웹
- 자바스크립트
- 프로그래머스코테
- 백준알고리즘
- 프로그래머스
- JS프로그래머스
- 리액트댓글기능
- dp알고리즘
- 알고리즘
- 백준골드
- 백준js
- 백준nodejs
- 안드로이드 스튜디오
- 리액트
- 백준구현문제
- 백준
- 다이나믹프로그래밍
- 코테
- 몽고DB
- css기초
- CSS
- 코딩테스트
- HTML5
- HTML
- 익스프레스
Archives
- Today
- Total
개발새발 로그
D3를 사용하기 위한 SVG에 대해 알아보기 본문
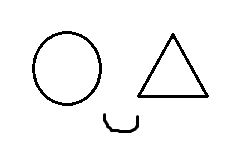
SVG 태그로 여러가지 도형 그리기
<html>
	<body>
    	<svg>
        	<!-- 원 -->
        	<circle cx="100" cy="50" r="20" />

            <!-- 타원 rx는 가로 반지름 ry는 세로 반지름-->
        	<ellipse cx="50" cy="25" rx="40" ry"20" />

            <!-- 직사각형 -->
        	<rect x="0" y="0" width="100" heigth="20" />

            <!-- 모서리가 둥근 직사각형 -->
        	<rect x="0" y="0" width="100" height="20" rx="10" ry="10"/>

            <!-- 다각형 -->
        	<ploygon points="100,0 50,50 150,50 />

            <!-- 선 stroke 설정해야 보임-->
        	<line x1="0 y1="0" x2="200" y2="50" stroke="black">

            <!-- path -->
        	<path d="M 0 50 q 50 -50 100 0 l 100 0"/>
            <!-- M 0 50 : 시작할 위치-->
            <!-- l 100 0 : x y 값으로 (100,0)까지 선을 그린다. -->
            <!-- q 50 -50 100 0 : (50,-50) 가운데 제어점, (100.0) 끝 제어점으로 곡선을 그림 -->

            <!-- 문자 -->
        	<text x="10" y="25" font-size="20">SVG 문자</text>

        </svg>


    </body>
</html>
SVG에 스타일 속성 입히기
<svg width="500px" height="500px">
    <circle cx="100" cy="50" r="40" fill="rgba(0,0,255,0.5)" />
    <circle cv="50" cy="50" r="40" fill="rgb(0,0,255)" opacity="0.5"/>
</svg>
<!-- stroke 속성 -->
<!-- stroke: stroke 색상 -->
<!-- stroke-width: stroke 너비 -->
<!-- stroke-opacity : stroke의 투명도 -->
<!-- stroke-linecap: stroke의 끝 모양 설정, buff/round/square 세가지 형태 지정 가능 -->
<!-- stroke-dasharray : stroke 마디의 길이를 지정하면서 점선형태로 설정 -->

<svg width="500px" height="500px">
    <text x="0" y="20" font=weight="bold">Linecaps</text>
    <text x="0" y="50">Butt</text>
    <line x1=60" y1="45" x2="200" y2="45" class="linecap-demo" stroke-linecap="butt"></line>
    <text x="0" y="50">Round</text>
    <line x1=60" y1="65" x2="200" y2="65" class="linecap-demo" stroke-linecap="round"></line>
    <text x="0" y="50">Square</text>
    <line x1=60" y1="85" x2="200" y2="85" class="linecap-demo" stroke-linecap="square"></line>
</svg>
<!-- SVG 출력순서 설정하기 -->
<!-- SVG는 선언되는 순서에 따라 그려짐-->
<!-- 코드에 처음 작성된 요소부터 출력 -->

<style>
	svg text {
    	text-anchor: middle;
        fill: lightgrey
    }
    svg rext {
    	fill: crimson
        opacity: 0.5;
    }

</style>

<svg width="500px" height="500px">

	<text x="100" y="35">Text on bottom</text>
    <rect x="0" y="0" width="200" height="60"/>

    <rect x="250" y="0" width="200" height="60"/>
    <text x="350" y="35">Text on bottom</text>
</svg>
<!-- g 태그 활용하기 -->
<!-- <g> 태그를 통해 요소를 그룹화 할 수 있습니다.-->

<!-- transform 속성으로 SVG 요소를 변형시키고, 움직이거나 회전시킬 수도 있습니다. -->

<style>
	.blue-group{
    	fill: blue;
        stroke-width:3;
    }
    .red-group {
    	fill: red;
        stroke-width:4;
        font-weight: bold
    }

    .green-group {
    	fill: green;
        stroke-width:3;
        opacity: 0.5
    }

</style>

<svg width="600px" height="500px">

	<g class="blue-group" transform="scale(1.2)">
        <text x="0" y="20">Blue group</text>
        <rect x="0" y="40" width="50" height="50" rx="10" ry="10" />
        <polygon points="80,30 70,70 130,50"/>
        <line x1="60" y1="75" x2="120" y2="90" stroke="blue"/>
	</g>

    <g class="blue-group" transform="translate(200)">
        <text x="0" y="20">Red group</text>
        <rect x="0" y="40" width="50" height="50" rx="10" ry="10" />
        <polygon points="80,30 270,70 330,50"/>
        <line x1="60" y1="75" x2="120" y2="90" stroke="red"/>
	</g>

    <g class="blue-group" transform="translate(200,120)">
        <text x="0" y="20">Green group</text>
        <rect x="0" y="40" width="50" height="50" rx="10" ry="10" />
        <polygon points="80,30 70,70 130,50"/>
        <line x1="60" y1="75" x2="120" y2="90" stroke="green"/>
	</g>
</svg>
SVG로 막대 차트 만들기
비율을 보여주기 위해서는 아래와 같이 해야한다.

- 가장 큰 비율 값을 보여주고 싶은 길이에 나눈다.

- 나온 값을 전체 값에 곱해준다.
축 지점 설정 방법

위치 값은 아까 비율값을 곱해주면 된다.
<!DOCTYPE html>
<html lang="en">
<head>
    <style>
	//스타일은 지정해주면 됨
    </style>
</head>
<body>
    <!-- 막대 차트 만들기 -->
    <!-- 1. 막대 만들기 -->
    <!-- 2. 데이터 넣기 -->
    <!-- 3. 데이터 값 비율에 맞게 막대 너비 조절 -->
    <!-- 4. 라벨 추가하기 -->
    <!-- 5. 축 추가하기 -->
    <!-- 6. 스타일 추가하기 -->
    <h2>2019sus 1000만 관객 기록한 영화 관객수 TOP7</h2>
    <div>
        <p>영화</p>
    </div>
    <div>
        <p>관객수</p>
    </div>
    <svg width="600px" height="500px">
        <g transform="translate(150,30) scale(0.00002459270787,1)">
            <rect x="0" y="0" heigth="20" width=""/>
            <rect x="0" y="25" heigth="20" width=""/>
            <rect x="0" y="50" heigth="20" width=""/>
            <rect x="0" y="75" heigth="20" width=""/>
            <rect x="0" y="100" heigth="20" width=""/>
            <rect x="0" y="125" heigth="20" width=""/>
            <rect x="0" y="150" heigth="20" width=""/>
        </g>
        <g>
            <text x="0" y="45">극한직업</text>
            <text x="0" y="70">어벤져스:엔드게임</text>
            <text x="0" y="95">겨울왕국2</text>
            <text x="0" y="120">알라딘</text>
            <text x="0" y="145">기생충</text>
            <text x="0" y="170">엑시트</text>
            <text x="0" y="195">스파이더맨:파 프롬 홈</text>
        </g>

        <g transform="translate(150,30)" stroke="black">
            <line x1="0" y1="0" x2="0" y2="-10"/>
            <line x1="135.25" y1="0" x2="135.25" y2="-10"/>
            <line x1="270.51" y1="0" x2="270.51" y2="-10"/>
            <line x1="405.77" y1="0" x2="405.77" y2="-10"/>
        </g>
         <g transform="translate(150,30)" text-anchor="middle">
            <text x="0" y="-15">0</text>
            <text x="135.25" y="-15">550만명</text>
            <text x="270.51" y="-15">1100만명</text>
            <text x="405.77" y="-15">1650만명</text>
        </g>
    </svg>
</body>
</html>
728x90
반응형
LIST
'자바스크립트' 카테고리의 다른 글
| D3.js 데이터 조인 (2) | 2024.01.24 |
|---|---|
| D3.js 첫 시작하기 - 기본 메서드들 사용 (1) | 2024.01.23 |
| 웹 보안 공격 이론 - HTTPS의 원리 (0) | 2023.12.14 |
| JS - intersection observer, 커스텀 이벤트 (0) | 2023.12.06 |
| fetch의 에러처리 문제 (0) | 2023.11.30 |
'자바스크립트' Related Articles
more


